


Table of contents

No headings in the article.
Recently, we decided to expand our car selling platform with a new search feature that allowed consumers to search for dealerships in their area based on unique metrics that we extract from their historic inventory data like average prices, models, and more.
To do this, we had to dive into front-end charting for the first time. Our django / python backend has been great for us across a variety of features we've built, but our team's Javascript experience is significantly less than python. As such in our search for the ideal charting library we were hesitant to dive too deep into complicated js options or things that required heavy lifting on setup.
A few options we considered:
Recharts
CanvasJS
C3.js
Ultimately we decided to go with Chart.js because of a few main benefits. First, it's very low setup cost made playing around with its features quick and easy. Second, it is very well adopted across many platforms and offers clean and thorough documentation & support. There's nothing more frustrating than bringing on a new library that turns out to be a huge headache to understand or find documentation for.
Despite our initial concerns that this foray into a javascript only library was going to be a tough journey, adding chart.js to our django platform ended up being a cinch.
To get started, you just have to add the package to the page you'd like to add charts to:
<script src="https://cdn.jsdelivr.net/npm/chart.js"></script>
Note there may also be an option to add a charting library directly to your python environment using pip install django-charts. For simplicity and ease of starting, we just added the script library to our required pages.
Once you've added the script, you can then start generating charts with their pretty simple constructor calls.
We had our 'x-axis' data in a dictionary key accessed with: inventory.new.models.items.model
We had our 'y-axis' data in a dictionary key accessed with: inventory.new.models.items.num
To generate the chart we simply use django templating to loop through the dictionaries in the chart instantiation script.
<script async>
const ctx = document.getElementById('newInventoryChart');
new Chart(ctx, {
type: 'bar',
data: {
labels: [
{% for model, num in inventory.new.models.items %}'{{ model }}',{% endfor %}
],
datasets: [{
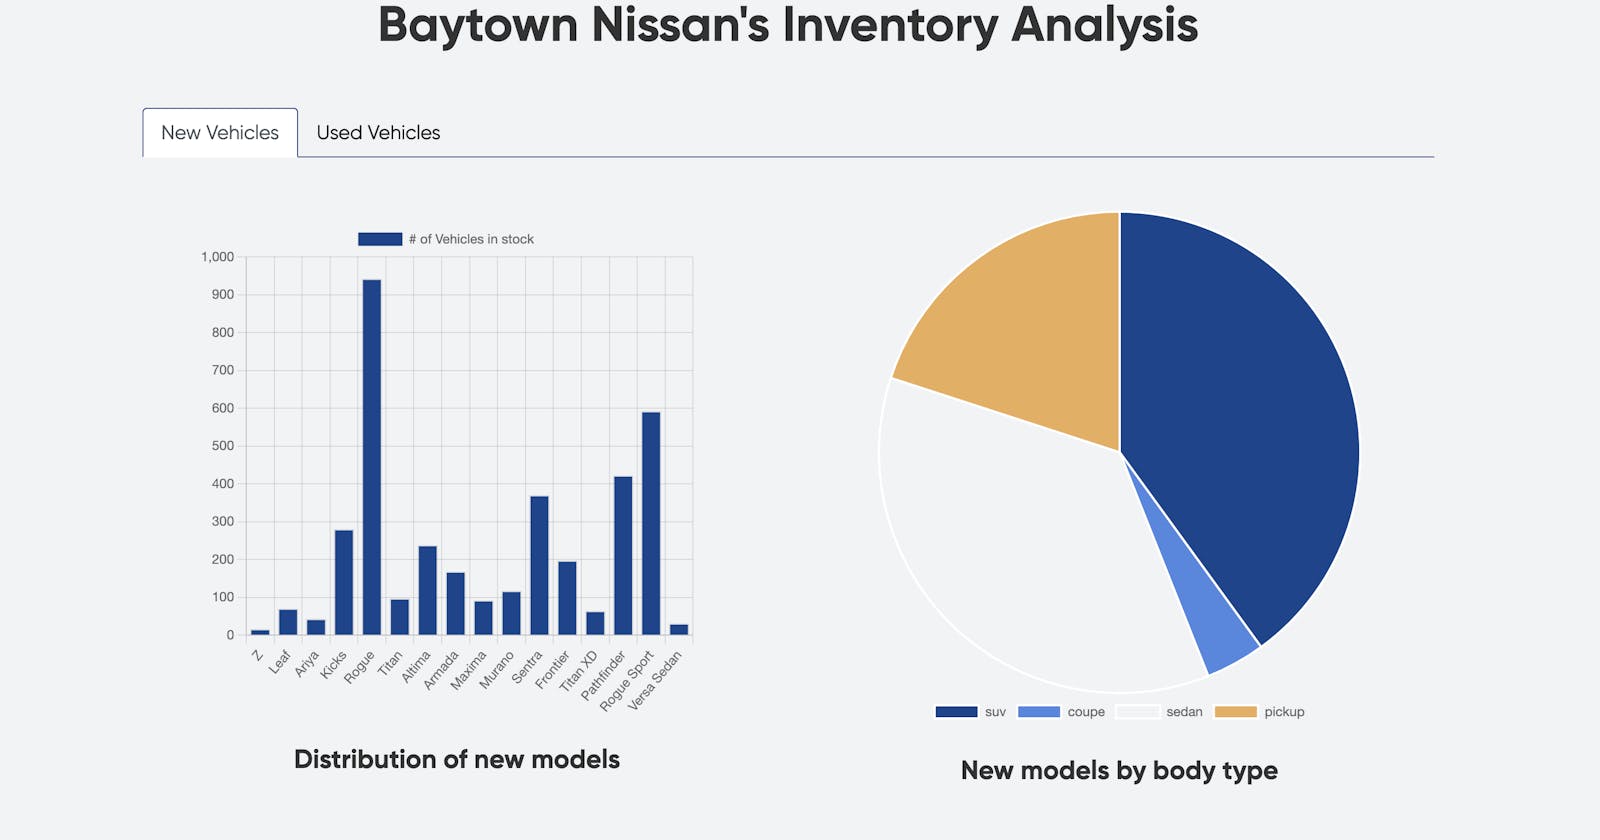
label: '# of Vehicles in stock',
data: [
{% for model, num in inventory.new.models.items %}{{ num }},{% endfor %}
],
borderWidth: 1,
backgroundColor: '#17428f'
}]
},
options: {
scales: {
y: {
beginAtZero: true
}
},
aspectRatio: 1
}
});
</script>
Once you've done this, you're pretty much done. All you need to do is ensure you have an html tag somewhere that matches the 'id' that you used in the chart constructor. Chart.js will automatically take care of generating the visual for you on page load.
For now, we have a mix of charts and basic metrics for each dealership, but plan to expand the single-point metrics into over-time charting with the library. For instance, Bayway Chevrolet below shows the average price, most popular model, and number of vehicles sold across both the new and used car departments.

We would like to be able to add the ability to on-the-fly generate new charts based on user input. For instance, if the user is searching for Silverados they could click to filter by model and get detailed metrics for just that vehicle. Eg. pricing changes, popular features, cost to own, etc.
Because it's relatively expensive from a load time perspective to just add all possible charts in the initial template, we expect to build out additional REST APIS that will allow the frontend to pull new chart data as it's needed.
I hope this has been helpful to anyone considering adding Chartjs to their django application and would be happy to answer any questions in the comments. As I mentioned, it is quite easy to get up and running and you shouldn't be concerned if you're not a JS pro!